


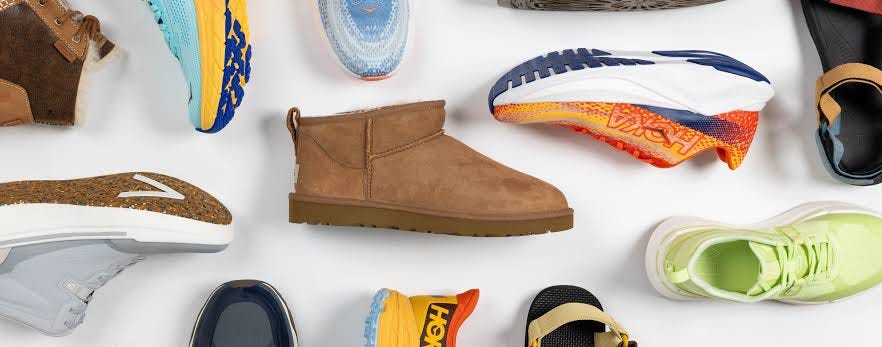
EEV Analysis: Deckers Outdoor Corporation
OVERALL PORTFOLIO ACTION: YELLOW / HOLD / WATCHLIST — Deckers is a financially strong, high-return footwear company trading at a much more reasonable valuation than its prior peak, but the business sits in a trend-sensitive consumer category and the current price does not create a clear enough path to double capital within three years under conservative assumptions.
I. Market Environment (E) - (Pillar 1 Analysis)
A. Operating Leverage vs. Economic Cycle
Deckers is operating from a strong profit base, but it is still tied to the consumer spending cycle because UGG, HOKA, Teva, and the rest of the portfolio compete in discretionary footwear and apparel. Trailing twelve-month revenue is about $5.53 billion, up roughly 7.9% versus the comparable prior twelve-month period, while diluted EPS across the latest four quarters is roughly $7.04, up about 8.1% from the prior comparable period. That shows earnings are still growing in line with revenue rather than collapsing under cost pressure. Over the longer window, the story is stronger: fiscal 2026 revenue of about $5.47 billion is more than double the fiscal 2021 estimate base of about $2.43 billion, implying an approximate five-year revenue CAGR near 17.6%, while EPS expanded from about $2.18 to roughly $7.03, implying an approximate five-year EPS CAGR near 26%. That spread shows real operating leverage and share-count discipline, not just top-line growth.
The current margin structure remains healthy. Gross margin is 57.8% TTM and operating margin is 22.7% TTM, leaving an operating overhead gap of about 35.1 percentage points. That overhead burden is meaningful because the brand model requires marketing, product design, distribution, retail support, and global channel management, but it has not broken the earnings model. The latest TTM operating margin is below the extremely strong seasonal quarter peaks but remains strong compared with the company’s own recent expansion cycle. Capital consumption is low: capital expenditures are only about 1.37% of revenue, and fixed asset turnover is 7.18x, so Deckers is not a heavy industrial business that must constantly pour cash into physical assets just to stand still. The main cycle risk is not factory utilization or debt-funded fixed assets; it is demand volatility if HOKA growth cools or UGG demand turns promotional.
Inventory is the key early-warning item for this archetype. Latest inventory is $807.6 million, down from $849.4 million one year earlier, while the latest quarter’s revenue rose from $964.5 million to $1.02 billion. That is a favorable inventory-to-sales setup because inventory is not growing faster than sales. Days inventory outstanding is still high at 126.4 days, which is normal for a seasonal footwear business but must be watched closely heading into holiday selling periods. For now, the numbers do not show the classic consumer-brand problem where unsold product piles up and forces markdowns.
B. Financial Leverage vs. Credit Cycle
Deckers has a fortress balance sheet for a consumer discretionary company. Latest cash and short-term investments are $1.60 billion, while total debt, including lease obligations, is $472.3 million, leaving net cash of about $1.13 billion. Net debt to EBITDA is negative at approximately -0.81x, which means creditors are not controlling the equity story. Debt to equity is only 0.21x, debt to assets is 0.12x, and the company does not show dependence on conventional borrowings to fund growth.
The interest burden is almost irrelevant to the investment case. Interest coverage is approximately 327.8x on a TTM basis, and the TTM debt service coverage ratio is about 286.2x. In plain English, operating earnings are far larger than interest obligations. Even if rates remain high, Deckers is not being forced to refinance large operating debt at punitive rates. The company has lease obligations tied to its store and operating footprint, with current lease obligations of $73.4 million and non-current lease obligations of $399.0 million at the latest quarter, but those claims are comfortably covered by liquidity and cash generation.
The company is also self-funding. TTM operating cash flow is about $1.19 billion, TTM free cash flow is about $1.12 billion, and TTM capex is only about $75.9 million. That free cash flow base has supported very large repurchases without stressing the balance sheet. In the latest quarter alone, Deckers repurchased $338.2 million of stock, and over the latest four quarters repurchases were over $1.2 billion. That level of buyback spending reduces cash, but the company still ended the latest quarter with over $1.6 billion of cash, so the credit-cycle risk remains low.
C. Investor Sentiment & Market Appetite
The market has already reset expectations materially. Deckers trades at $82.89 per share, down from a 52-week range high of $122.29, and the current TTM P/E is 11.74x. The current price-to-free-cash-flow ratio is 10.10x, and EV/EBITDA is 7.30x. Those are not hype-cycle multiples for a company still producing 57.8% gross margins, 22.7% operating margins, and a 33.7% ROIC. The earnings yield is 8.86%, and the free cash flow yield is 9.90%, both comfortably above the current 10-year Treasury yield of 5.24%. That gives the equity a real cash-return cushion versus bonds, which is important because consumer brands can re-rate quickly when demand slows.
Technical sentiment is neutral rather than overheated. The 14-day RSI is 53.18, which does not show panic selling or speculative crowding. The share price has corrected from prior highs, but it has not reached an obvious technical washout either. The setup is more “valuation reset” than “forced liquidation.” The main sentiment risk is that investors may continue to question whether HOKA and UGG can sustain premium growth in a slowing discretionary environment. At the current multiple, however, the market is no longer demanding perfection.
Conclusion - Market Environment (E)
Pillar Status: GREEN — Deckers has low financial leverage, a net cash balance sheet, strong cash generation, and a valuation yield that beats the 10-year Treasury. The consumer cycle still matters, but the company has enough balance-sheet strength and margin cushion to handle a normal slowdown.
II. Business Evaluation (E) - TRUMP Scorecard - (Pillar 2 Analysis)
A. Total Business Quality & Management Track Record (T)
Deckers scores very well on basic business survival quality. The quick ratio is 1.99x, the current ratio is 2.75x, and cash alone is $1.60 billion against latest current liabilities of $1.06 billion. TTM operating cash flow of about $1.19 billion also covers current liabilities by roughly 1.12x, so the company is not dependent on emergency financing or inventory liquidation to meet short-term obligations. Earnings quality is also strong over a full-year view. TTM free cash flow of $1.12 billion exceeds TTM net income of $1.01 billion, creating a free cash flow conversion rate of about 110%. The quarterly cash-flow pattern is seasonal and lumpy, with large working capital releases in holiday quarters and working capital absorption in earlier quarters, but the full-year cash result remains strong.
Management has also been disciplined with per-share capital allocation. Diluted shares outstanding have fallen from roughly 165.0 million in fiscal 2022 enterprise value records to about 138.6 million in the latest quarter, a reduction of roughly 16% over the period. That is a meaningful per-share value driver. The company pays no dividend, which is the right policy for a high-return business that can reinvest in brand growth and repurchase shares. Insider transaction records show many equity awards and tax-related in-kind dispositions, plus several open-market sales, but no visible open-market insider buying trend. That is not ideal from an alignment perspective, though the bigger capital allocation fact is that the company itself has been aggressively retiring shares.
B. Returns & Capital Efficiency (R)
The return profile is excellent. ROIC is 33.7% TTM, ROE is 41.1% TTM, and return on tangible assets is 26.4% TTM. Using TTM EBIT of roughly $1.32 billion and the company’s effective tax rate of about 22.7%, estimated NOPAT is approximately $1.02 billion. Against tangible asset value of about $2.27 billion, that implies a rough ROTIC near 45%, which confirms that Deckers is not an asset-heavy business. It makes money through brand strength, product design, channel execution, and premium pricing rather than through massive physical capital deployment.
The company’s reinvestment burden is modest. Capex is only 6.36% of operating cash flow and 1.37% of revenue, while capex to depreciation is about 1.01x. That suggests the physical capital base is being maintained without absorbing most of the cash flow. The dividend payout ratio is 0%, and the company has used excess capital primarily for buybacks. That is generally attractive because the current P/E of 11.74x is well below the kind of multiple the market previously assigned to Deckers during its stronger sentiment period. The risk is that some repurchases were made at higher prices earlier in the cycle, but the current valuation makes ongoing repurchases more economically attractive.
C. Understandability & Simplicity Filter (U)
The business is easy to understand. Deckers designs, markets, and distributes footwear, apparel, and accessories through a portfolio led by UGG and HOKA, with Teva, Sanuk, and Koolaburra as smaller supporting brands. The model is not a financial black box. It sells branded consumer products through wholesale partners, owned stores, and e-commerce. Revenue depends on brand heat, product innovation, channel discipline, and consumer willingness to pay premium prices.
The growth profile is still strong, but it is no longer in the early explosive phase. Fiscal 2026 revenue grew 9.8%, operating income grew 7.1%, and EPS grew 10.9%. Analyst estimates show revenue rising to about $5.88 billion in fiscal 2027 and $6.31 billion in fiscal 2028, while EPS is expected to move from about $7.53 in fiscal 2027 to $8.34 in fiscal 2028 and $12.64 by fiscal 2030. That supports a medium-to-high growth profile rather than a distressed or stagnant one. Still, the consumer brand override matters here: footwear customers have nearly zero switching costs, and growth can slow quickly if the market decides a brand is no longer culturally fresh.
D. Competitive Moat & Pricing Power (M)
Deckers has real brand power, but it should not be treated like an unbreakable toll bridge. Gross margin of 57.8% TTM is strong and has held near recent high levels, showing that the company has not had to discount heavily to move product. That is important because consumer brands often show trouble first through gross margin decay. The latest inventory trend is also supportive because inventory declined year over year while revenue rose, reducing the risk of near-term markdown pressure.
UGG has multi-decade brand relevance and remains a strong lifestyle franchise, while HOKA has become a major performance footwear growth engine. That combination gives Deckers more durability than a single-product fad business. Even so, apparel and footwear are trend categories. A competitor with enough marketing money cannot instantly recreate UGG’s history or HOKA’s credibility with runners, but consumers can switch brands tomorrow if product momentum fades. For that reason, Deckers deserves a strong brand-quality score, but not the same moat treatment as a software platform with high switching costs or a regulated monopoly.
E. Predictability & Visibility Test (P)
Deckers has produced a strong multi-year earnings staircase. Revenue per share, operating cash flow per share, and net income per share have all compounded materially over the last several years, helped by both operating growth and share repurchases. EPS growth has outpaced revenue growth over the longer period, which shows that management has converted top-line gains into per-share profit growth rather than simply buying growth at weak margins.
The visibility is good, but not perfect. Analyst estimates show continued growth through fiscal 2030, with revenue expected to rise from roughly $5.88 billion in fiscal 2027 to about $7.48 billion in fiscal 2030. That implies the market still sees room for global expansion, especially in HOKA and international direct-to-consumer channels. The risk is that consumer brands rarely compound in a perfectly straight line. HOKA’s growth runway is attractive, but if demand slows, inventory builds, or competitors attack the category with heavy promotions, the earnings path could become less smooth. The current data does not show that problem yet, but the business model requires ongoing proof.
Conclusion - Business Evaluation (E) - TRUMP Scorecard
Pillar Status: YELLOW — Deckers has elite returns, strong cash conversion, excellent liquidity, and disciplined buybacks, but the footwear category carries real trend risk and low customer switching costs. It is a very good business, but not an “environment-proof” compounder.
III. Business Valuation (V) - (Pillar 3 Analysis)
A. Yield Spreads & Growth-Adjusted Multiples
The valuation is attractive on basic cash yield. At $82.89, Deckers trades at 11.74x TTM earnings and 10.10x TTM free cash flow. That creates an 8.86% earnings yield and a 9.90% free cash flow yield, both comfortably ahead of the 5.24% 10-year Treasury yield. The spread is meaningful because investors are being paid in current owner earnings rather than relying only on future multiple expansion. EV/EBITDA is 7.30x, EV/free cash flow is about 9.09x, and EV/sales is 1.84x, which are modest for a company with a 57.8% gross margin and 33.7% ROIC.
Forward valuation also looks reasonable. Based on fiscal 2027 consensus EPS of $7.53, the forward P/E is about 11.0x. Based on fiscal 2028 consensus EPS of $8.34, the forward P/E falls to about 9.9x. Using current enterprise value of about $10.16 billion and fiscal 2027 estimated EBITDA of about $1.49 billion, forward EV/EBITDA is roughly 6.8x. The TTM PEG ratio is 1.45x, while the forward PEG ratio is 1.26x, so the stock is not a classic deep-value PEG-below-1 setup, but the valuation is still reasonable relative to the company’s cash generation and expected growth. The main issue is not that Deckers is expensive; it is that the category risk makes it hard to underwrite a very high terminal multiple.
B. Intrinsic Value & Institutional Alignment (2x in 3 years?)
The valuation should be handled under the discretionary consumer brand framework, not as a software platform or permanent toll-road business. Because Deckers has no non-controlling interest complication and reports in USD, the cleanest scope is an equity owner-earnings approach using diluted shares. TTM free cash flow is $1.12 billion, but because working capital is seasonal and holiday quarters create large cash releases, a normalized owner-earnings base closer to $1.05 billion is more conservative. That still reflects a healthy business because it is based on full-year cash generation, low capex needs, and strong profit conversion.
For a consumer footwear brand with excellent financial returns but real trend risk, a 15x normalized owner-earnings multiple is reasonable. That multiple gives credit for the 33.7% ROIC, strong gross margins, net cash balance sheet, and buyback discipline, while staying below the top-tier platform multiples that should not be applied to trend-sensitive apparel and footwear names. On $1.05 billion of normalized owner earnings, estimated equity value is about $15.75 billion. Dividing by roughly 138.6 million diluted shares produces an estimated current intrinsic value near $114 per share. That is meaningfully above the current $82.89 price and suggests the stock is undervalued on a cash-owner basis.
The three-year hurdle is more demanding. If normalized owner earnings compound at a conservative 10% annually, year-three owner earnings would reach about $1.40 billion. Applying the same 15x multiple produces an estimated year-three equity value of about $20.96 billion, or roughly $151 per share on the current diluted share base. Continued repurchases could lift that per-share outcome, but using the current share count keeps the math disciplined. The 2x hurdle requires a three-year value of about $166 per share, so the base case does not clearly clear the hurdle. The answer is NO: Deckers does not provide an unequivocal path to double capital in three years under conservative brand-risk assumptions. The return engine is mainly current undervaluation plus steady cash compounding, not a clear 2x asymmetry. Institutional-style validation is more visible through the company’s own aggressive buyback program than through outside smart-money accumulation evidence, and that still supports the thesis, but it does not turn the setup into a no-brainer entry.
Conclusion - Business Valuation (V)
Pillar Status: YELLOW — Deckers looks undervalued versus current cash flow and forward earnings, but the conservative three-year intrinsic value case falls short of the 2x hurdle. The stock is attractive enough for a watchlist or existing hold, but not an automatic aggressive buy.
IV. Summary & Conclusions
Pillar 1: Market Environment (E): GREEN — Deckers has a net cash balance sheet, very high interest coverage, strong free cash flow, and an equity yield that beats the 10-year Treasury. The macro risk is consumer demand, not solvency.
Pillar 2: TRUMP Scorecard - Business Evaluation (E): YELLOW — The business has excellent returns, strong margins, low capital intensity, and major share-count reduction, but footwear is still a trend-sensitive category with low customer switching costs.
Pillar 3: Business Valuation (V): YELLOW — The stock trades at a reasonable 11.74x TTM earnings and 10.10x TTM free cash flow, but the conservative three-year valuation case does not clearly reach the 2x return target.
FINAL VERDICT (OVERALL EEV): YELLOW / HOLD / WATCHLIST — Deckers is a high-quality consumer brand operator with strong cash generation, excellent returns on capital, and a much more attractive valuation than it had near prior highs. The stock is not priced like a bubble, and current cash yields provide a real margin of safety versus bonds. The rating stops short of a buy because the business depends on continued brand heat from HOKA and UGG, and the conservative three-year model does not clearly double the current share price. To upgrade the rating, Deckers would need to keep inventory growth below revenue growth, hold gross margin near current levels, continue reducing share count at attractive prices, and show that HOKA growth can remain durable without promotional discounting.
FORWARD-LOOKING TRAJECTORY - THE INFLECTION LENS: YELLOW / HOLD / WATCHLIST — Deckers is not a classic turnaround or distressed inflection case because the trailing fundamentals are already strong. The forward setup is more about whether the recent valuation reset has created enough upside before the market fully trusts the next leg of growth. The normalized free cash flow yield is close to 10%, inventory is not flashing a major warning sign, and analyst estimates still show EPS growth through fiscal 2030. That creates a constructive forward risk/reward, but not enough asymmetry to treat the stock as a clear inflection buy before further proof of sustained HOKA and UGG demand.
About This Report: Investing success is achieved by combining two distinct components: (A) a repeatable process that shifts the focus from speculative headlines to disciplined analysis, and (B) leveraging that process to answer three questions before risking your hard-earned money: Is this the right business (Business Evaluation)? Is this the right time (Market Environment)? And is this the right price (Business Valuation)? By executing within this framework, we raise the bar on equity evaluation to help you identify investments built on a solid footing with long-term compounding potential.
Generated by The EEV Investor — www.eevinvestor.com
© 2026 The EEV Investor. All rights reserved.