


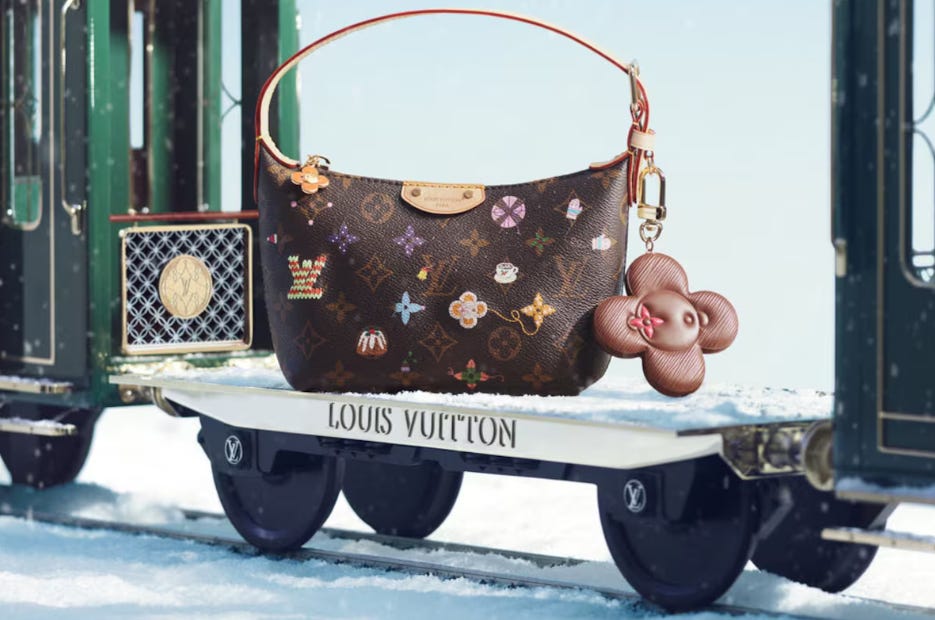
EEV Analysis: LVMH, Louis Vuitton
OVERALL PORTFOLIO ACTION: YELLOW / HOLD / WATCHLIST — LVMH remains one of the highest-quality brand portfolios in the world, but the current setup is a “great business at a reasonable price,” not a clean 3-year double. Existing holders can continue to own it, while new capital should wait for either a lower entry price or clearer evidence that luxury demand and margins are re-accelerating.
All financial statement figures below are presented in U.S. dollars. LVMH reports in euros, and all euro-denominated financial statement items were converted at an applied EUR/USD rate of 1.168, consistent with the stated dividend translation in the provided market data.
I. Market Environment (E) - (Pillar 1 Analysis)
A. Operating Leverage vs. Economic Cycle
LVMH is exposed to the economic cycle because luxury demand slows when high-end consumers pull back, especially in categories like fashion, watches, jewelry, spirits, and travel retail. The latest trailing revenue base is about $92.9B, down roughly 3.9% year over year when comparing the most recent twelve-month period against the prior comparable twelve-month period. EPS has held up better, with trailing diluted EPS around €21.92, nearly flat against the prior comparable period, but that stability hides a clear margin reset from the 2021–2023 luxury boom. Gross margin remains very strong at 66.4% TTM, but it has slipped from a five-year average closer to 67.8%, while EBIT margin has compressed to about 21.6% TTM versus a five-year average near 24.7%. That means the company is still highly profitable, but the post-pandemic pricing and demand surge has normalized. The operating overhead gap, calculated as gross margin less operating margin, now sits near 44.8 percentage points, above the five-year average near 43.1 percentage points, showing that store payroll, marketing, retail infrastructure, and brand support costs are not flexing down as quickly as revenue. This does not make the business fragile, but it does show that LVMH’s cost base has grown with its global retail footprint and can pressure earnings during a luxury downcycle.
The capital intensity profile is moderate, not excessive. Trailing depreciation and amortization is about $7.7B, or 8.3% of revenue, while capital expenditure is about $5.0B, or roughly 5.4% of revenue. This is not an asset-light software model, but for a luxury house that owns stores, production facilities, vineyards, logistics assets, and hospitality exposure, the reinvestment burden is manageable. Asset turnover is about 0.56x, broadly in line with the current TTM ratio reported in the operating metrics, meaning the company is still generating a reasonable amount of sales from its asset base despite a larger balance sheet after acquisitions and store investments. The main cash-cycle issue is inventory: average inventory days are about 333 days, and inventory on the latest balance sheet is approximately $28.5B. That is normal in some parts of luxury, especially watches, wines, spirits, and timeless leather goods, but it still ties up cash when demand cools. Free cash flow conversion remains strong, however, with TTM free cash flow of about $16.8B versus net income of about $12.7B, showing that the business is still converting accounting profit into real cash even during a softer luxury cycle.
B. Financial Leverage vs. Credit Cycle
The balance sheet is solid and does not look stressed by the current credit cycle. Latest total debt is about $42.7B, cash and short-term investments are about $14.2B, and net debt is about $34.8B. Against trailing EBITDA of roughly $27.8B, net debt to EBITDA is about 1.25x, which is very manageable for a global luxury leader with high gross margins, strong brands, and recurring cash generation. Interest coverage is also healthy. Trailing EBIT is roughly $20.1B if using operating income or about $20.1B equivalent against the stated TTM ratio base, while the reported interest coverage ratio is 15.9x, leaving a wide cushion between operating profit and debt service. The company is not being run for creditors; lenders are a manageable claim on the enterprise, not the center of the investment case.
The capital structure also looks balanced. Debt to equity is about 0.54x, and debt to assets is roughly 0.26x, both reasonable for a business that owns meaningful physical infrastructure but still generates luxury-brand margins. The quick ratio is weaker at 0.77x, because LVMH carries large inventories and operates a retail-heavy structure, but this should be viewed in context. The current ratio is 1.63x, operating cash flow over the trailing period is about $21.8B, and free cash flow after capital expenditure is still substantial. The company paid about $8.3B in dividends and repurchased about $2.4B of stock over the latest twelve-month cash flow period, while still maintaining a conservative leverage profile. That said, the dividend payout ratio is high at roughly 61% of net income, so shareholder distributions absorb a meaningful part of cash flow. This is not a debt-driven expansion story, but there is less retained cash for aggressive reinvestment than the purest owner-operator compounders would keep.
C. Investor Sentiment & Market Appetite
At the current price of $439.73, LVMH’s current market capitalization is about $216.8B. Using trailing net income of about $12.7B, the stock trades around 17.1x trailing earnings, while trailing free cash flow of about $16.8B puts the stock near 12.9x P/FCF. That is a much more reasonable entry point than the premium multiples LVMH commanded during the luxury boom, and the valuation now offers a real cash-flow anchor. The earnings yield is about 5.9%, compared with the current U.S. 10-Year Treasury yield of 5.09%, giving LVMH a modest positive earnings yield spread. The free cash flow yield is stronger at about 7.7%, which gives investors a better cash return than the earnings multiple alone suggests.
Technical sentiment is not euphoric. The 14-day RSI is 41.6, which points to a stock that is neither overbought nor in forced-liquidation panic. The price range of $412.57 to $766.90 also shows that the market has already compressed the multiple and mood around luxury stocks. The current price is much closer to the lower end of that range than the high, which gives the setup some valuation support. The problem is that this is not a clear sentiment washout either. The stock has de-rated because revenue and margins are softening, not because the market has completely abandoned a strong business. In plain terms, the market is no longer pricing LVMH like perfection, but it is still giving the company credit for being a rare global brand asset.
Conclusion - Market Environment (E)
Pillar Status: YELLOW — LVMH has a strong balance sheet and a sane valuation backdrop, but the luxury cycle is soft and margins are still normalizing from unusually strong post-pandemic levels. The macro setup is manageable, not ideal.
II. Business Evaluation (E) - TRUMP Scorecard - (Pillar 2 Analysis)
A. Total Business Quality & Management Track Record (T)
LVMH is a very high-quality business, but it is not immune to slower consumer demand. The company owns one of the strongest collections of luxury brands in the world, including Louis Vuitton, Christian Dior, Tiffany, Bulgari, Hennessy, Dom Pérignon, Sephora, and many others. This gives it scale, pricing power, distribution control, and cultural relevance that smaller fashion or luxury names cannot easily copy. Liquidity is adequate, with a 1.63x current ratio, but the 0.77x quick ratio reflects the fact that a large portion of current assets sits in inventory rather than cash and receivables. That is not automatically a weakness in luxury, where inventory can retain value better than trend-driven mass apparel, but it does mean working capital matters. Cash generation is strong: trailing operating cash flow is about $21.8B, and free cash flow is about $16.8B, both comfortably above net income of about $12.7B. This is a key point in LVMH’s favor because even in a softer revenue period, the business is still producing real cash.
Management quality is a major part of the LVMH story. Bernard Arnault has led the group for decades and built the company through disciplined brand ownership, selective acquisitions, and tight control of distribution. This is not a short-tenured management team trying to manufacture growth through financial engineering. The latest share count is also moving in the right direction, with diluted shares around 495.0M, down from roughly 503M in the early 2020s. The reduction is not aggressive enough to be a major buyback thesis, but it shows capital discipline and avoids the dilution problem that can damage long-term compounding. The main capital allocation compromise is the dividend. The payout ratio of about 61% is high for a pure reinvestment compounder, and while dividends are common among mature European luxury companies, that cash is not being retained for buybacks, acquisitions, or internal reinvestment at high incremental returns.
B. Returns & Capital Efficiency (R)
LVMH’s return profile is strong by normal corporate standards but mixed under a strict compounding framework. Return on equity is healthy at 16.0% TTM, showing that the business still earns a solid return on shareholder capital. Return on invested capital is lower at 9.5% TTM, partly because the balance sheet carries significant goodwill and intangibles from acquisitions such as Tiffany and other brand investments. On a reported invested-capital basis, the current return is not exceptional, especially compared with LVMH’s own stronger periods. That is why this is not a perfect TRUMP scorecard outcome. The business is outstanding, but recent returns have been pulled down by slower revenue, lower margins, and a larger invested capital base.
The better angle is cash efficiency. Free cash flow to operating cash flow is about 80.7%, and capex consumes only about 19.3% of operating cash flow. That means LVMH is not stuck on a capital treadmill. The company spends real money on stores, production, supply chain, hospitality assets, and brand presentation, but these investments support premium pricing and controlled distribution. The current capital intensity ratio is about 5% of revenue, which is reasonable for a global luxury house. Buybacks have reduced the share count modestly, and recent repurchases were made while the stock was well below its prior highs, which is more rational than buying aggressively during peak sentiment. Still, because dividends consume a large share of profit and ROIC has slipped below the level expected from an elite compounding engine, the returns profile is good rather than flawless.
C. Understandability & Simplicity Filter (U)
LVMH is easy to understand at the customer level: it sells high-status luxury products and experiences through brands that wealthy customers trust and desire. The business is diversified across fashion and leather goods, wines and spirits, watches and jewelry, perfumes and cosmetics, selective retailing, hospitality, and media. That diversification lowers single-brand risk, but it also means the company is not as simple as a single-product compounder. Luxury demand is driven by brand heat, wealth effects, tourism flows, China demand, U.S. consumer strength, European travel, and currency movements. The core economics are clear, but the cycle drivers are broader than they first appear.
The five-year growth record remains strong. Revenue per share increased about 83% over five years, which implies a roughly 12.9% compound annual growth rate, while net income per share increased about 134%, implying roughly 18.5% annualized growth. That is excellent historical execution. But the more recent trend is much slower: 2025 revenue declined 4.6%, EPS declined 13.1%, and 2026 trailing revenue is still soft. That puts LVMH in the category of a high-quality stalwart that can compound over long periods, not a current fast grower. The business model is understandable, but the near-term slope of growth is no longer simple or automatic.
D. Competitive Moat & Pricing Power (M)
LVMH’s moat is built on brand power, controlled distribution, craftsmanship, scarcity, and cultural relevance. Louis Vuitton and Dior are not easily replicated because the value is not just the physical product; it is heritage, customer aspiration, global store experience, celebrity visibility, and decades of brand investment. A competitor could spend billions of dollars and still fail to recreate that trust and desirability. This matters because pricing power in luxury depends on customers accepting higher prices without seeing the product as interchangeable. LVMH has passed that test over many cycles.
The margin data supports the moat, even though it also shows recent normalization. Gross margin is still 66.4% TTM, compared with a five-year average near 67.8%. That is a small decline, not a collapse. Operating margin has fallen more visibly to about 21.6% from a five-year average near 24.7%, which shows that slower sales growth has pressured the cost structure, especially retail, marketing, and brand-support spending. Under the luxury goods override, LVMH deserves a higher durability score than ordinary apparel companies because its brands have multi-decade relevance across generations. This is not a fad-driven single-brand story. However, luxury still has zero formal customer switching costs, and demand can cool quickly when aspirational consumers trade down or delay purchases. The moat is real, but it does not eliminate cyclicality.
E. Predictability & Visibility Test (P)
LVMH’s long-term record is predictable by luxury standards, but the latest cycle shows that earnings are not a straight line. The company rebounded sharply after 2020, expanded margins through 2021–2023, then saw growth slow in 2024 and 2025. That is a normal luxury demand pattern, not a sign that the business is broken. The five-year numbers still show strong compounding, but the three-year trend tells a more cautious story, with three-year net income per share down about 22% in the latest growth data. The long runway remains intact because global wealth creation, tourism, premium beauty, jewelry, and luxury retail still provide multi-decade opportunities. But periods of digestion are part of the business model.
The biggest visibility risk is geographic and category concentration around global luxury demand, especially Chinese and travel-driven spending. LVMH’s scale helps because weakness in one region or category can be partially offset by others, but broad luxury slowdowns still flow through revenue and margins. The company’s predictability is far better than most discretionary consumer businesses, but not as stable as a mission-critical software platform or consumer staple. Investors should expect long-term compounding with cyclical pauses, not smooth annual growth every year.
Conclusion - Business Evaluation (E) - TRUMP Scorecard
Pillar Status: YELLOW — LVMH is an exceptional brand owner with strong cash conversion, deep management experience, and a durable moat, but recent margin compression, slower growth, high dividends, and a TTM ROIC of 9.5% keep it below the strictest high-conviction compounder standard.
III. Business Valuation (V) - (Pillar 3 Analysis)
A. Yield Spreads & Growth-Adjusted Multiples
The valuation is reasonable, but not a no-brainer. At $439.73 per share and a market value near $216.8B, LVMH trades around 17.1x trailing earnings and 12.9x trailing free cash flow based on converted TTM figures. The earnings yield is about 5.9%, slightly above the 5.09% 10-Year Treasury yield, while the free cash flow yield is stronger at about 7.7%. This gives the stock a real cash-flow foundation that was missing when LVMH traded much closer to peak luxury sentiment. Enterprise value is about $245.2B when using current market capitalization, latest total debt of $42.7B, and cash plus short-term investments of $14.2B. Against TTM EBITDA of about $27.8B, that implies an EV/EBITDA multiple near 8.8x, which is not demanding for a company with LVMH’s brand portfolio.
Growth-adjusted valuation is more balanced. The backward-looking five-year EPS growth rate is very strong because it includes the rebound from 2020 and the luxury boom, producing a historical PEG below 1.0x using the current earnings multiple. But the forward picture is slower. Consensus 2026 EPS is about €21.66, or roughly $25.31, implying a forward P/E near 17.4x. Consensus 2029 EPS is about €29.25, or roughly $34.16, which implies a projected EPS growth rate of about 10% annually from 2026 to 2029. On that forward growth base, the PEG sits closer to the mid-1x range. That is fair for LVMH, but it is not deeply discounted. The valuation now supports steady compounding, not obvious multiple expansion.
B. Intrinsic Value & Institutional Alignment (2x in 3 years?)
The cleanest valuation approach for LVMH is an equity owner-cash-flow model rather than a GAAP P/E shortcut. The company does not require a software-style adjustment, and it is not a bank, insurer, REIT, or commodity cyclical. Under the luxury goods override, the valuation multiple should be capped below platform-style levels because even elite luxury brands remain exposed to fashion cycles, tourism shifts, and consumer confidence. TTM free cash flow is about $16.8B, and because cash conversion is strong, this is a reasonable current owner-earnings base. Using a 17x normalized owner-earnings multiple, which fits a dominant multi-decade luxury franchise but still respects discretionary consumer risk, current intrinsic equity value is about $284.8B. Dividing that by roughly 495.0M diluted shares gives a current estimated intrinsic value near $575 per share. Against the current $439.73 price, the stock appears undervalued on a normalized cash-flow basis.
The three-year test is stricter. If owner earnings grow at about 7% annually, which is reasonable if luxury demand stabilizes and margins partially normalize, TTM owner cash flow would rise from about $16.8B to about $20.5B in three years. Applying the same 17x multiple gives a forward equity value near $348.7B. Assuming the diluted share count drifts modestly lower toward 492M through continued buybacks, the estimated three-year value is roughly $709 per share. That would be a strong return from today’s price, but it is not a double. A 2x outcome would require a future price of about $879 per share, which would need either faster cash-flow growth, a higher exit multiple, or both. Based on the current data, LVMH does not clear the 2x-in-3-years hurdle. The likely return engine is cash-flow recovery plus moderate multiple support, not explosive upside from a distressed starting valuation.
Institutional alignment is best understood through the nature of the company rather than short-term trading signals. LVMH is a long-duration, family-influenced luxury compounder with deep operating control and a management culture built around brand stewardship. That is a positive for long-term owners. The current valuation also makes the stock more attractive to quality-focused investors than it was near prior highs. Still, without a clear forced-selling discount or evidence of a sharp near-term inflection, the institutional setup looks supportive rather than overwhelmingly asymmetric.
Conclusion - Business Valuation (V)
Pillar Status: YELLOW — LVMH trades at a reasonable discount to normalized intrinsic value, with a solid free cash flow yield and fair forward multiple, but the modeled three-year value does not reach the 2x hurdle. The stock is attractive for patient ownership, not a “no-brainer” entry.
IV. Summary & Conclusions
Pillar 1: Market Environment (E): YELLOW — The luxury cycle is soft, revenue is slightly down, and margins have compressed from peak levels, but the balance sheet is strong and the valuation now offers a positive cash-flow spread over Treasury yields.
Pillar 2: TRUMP Scorecard - Business Evaluation (E): YELLOW — LVMH owns one of the best luxury brand portfolios in the world, converts profit into cash well, and has proven management, but recent ROIC, margin compression, and high dividend payout keep it below the strictest elite compounder rating.
Pillar 3: Business Valuation (V): YELLOW — The stock looks reasonably undervalued on normalized owner earnings, but it does not offer a clear path to doubling within three years at the current price.
FINAL VERDICT (OVERALL EEV): YELLOW / HOLD / WATCHLIST — LVMH is a high-quality business trading at a much more sensible valuation than it did during the luxury boom. The right strategy is to hold existing positions and watch for either a lower price or a clear operating recovery. An upgrade would require evidence that revenue growth has returned to a mid-single-digit or better pace, gross margin has stabilized near historical levels, operating margin is moving back toward the mid-20% range, ROIC is recovering above the cost of capital, and the entry price still leaves enough upside to approach the 2x-in-3-years hurdle.
FORWARD-LOOKING TRAJECTORY - THE INFLECTION LENS: YELLOW / HOLD / WATCHLIST — LVMH has a credible inflection setup, but not a fully asymmetric one. The stock has already de-rated, free cash flow yield is healthy at roughly 7.7%, and cash generation remains strong despite a softer luxury cycle. The issue is that the current weakness does not appear to be just a temporary accounting distortion; it reflects a real slowdown in luxury demand and operating margin normalization. If the next few periods show revenue stabilization, inventory discipline, and operating margin recovery, LVMH could shift from a fair-value compounder to a stronger accumulation candidate. For now, the evidence supports patience rather than aggressive new buying.
About This Report: Investing success is achieved by combining two distinct components: (A) a repeatable process that shifts the focus from speculative headlines to disciplined analysis, and (B) leveraging that process to answer three questions before risking your hard-earned money: Is this the right business (Business Evaluation)? Is this the right time (Market Environment)? And is this the right price (Business Valuation)? By executing within this framework, we raise the bar on equity evaluation to help you identify investments built on a solid footing with long-term compounding potential.
Generated by The EEV Investor — www.eevinvestor.com
© 2026 The EEV Investor. All rights reserved.